McGruv's Crime Map
Intrepid Rambix reader Derek I. (McGruv) has been a force to be reckoned with when it comes to exposing the slimy underbelly of Minneapolis crime, while at the same time holding the "leaders" feet to the fire.
Now he's taken his activism to a new level, having created a nifty color-coded crime map based on CODEFOR data. Below the map is part of his comments to me:
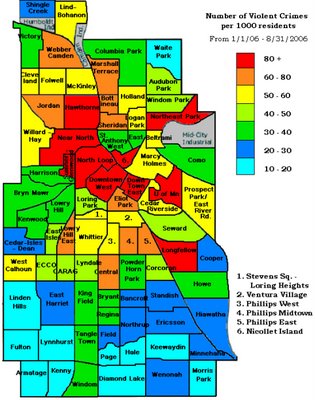
I see a fairly clear pattern of higher crime in the central city, focus on the northern half, radiating outward. That shouldn't be a surprise, though. Northeast Park seems to be an anomoly. Anyone detect other distinctive patterns?
As Derek asks, where is the Safe Zone?
Now he's taken his activism to a new level, having created a nifty color-coded crime map based on CODEFOR data. Below the map is part of his comments to me:

I thought you and your readers might be interested in some simple violent crime analysis I've put together. The attached Excel file details the number and frequency of violent crime in the city by neighborhood. The source of the data is the MPD's CODEFOR data posted on the city website.Yeoman's work, McGruv. The city should be paying you.
The frequency of violent crime is measured on a per capita basis, namely the number of crimes per 1000 residents. You'll see that the city has had about 50 violent crimes for every 1000 people who live here. That implies that as many as 5% of all people living in the city may have been a victim of a violent crime. Of course some people may have been victimized more than once or been from out of town but you get the idea.
I see a fairly clear pattern of higher crime in the central city, focus on the northern half, radiating outward. That shouldn't be a surprise, though. Northeast Park seems to be an anomoly. Anyone detect other distinctive patterns?
As Derek asks, where is the Safe Zone?
posted by Rambix at 8:17 PM
![]()

<< Home